User guide
1-Intro to Niphlem
1.1- What is Niphlem?
NeuroImaging-oriented Physiological Log Extraction for Modeling (Niphlem) is a toolbox designed to preprocess phsyiological signals collected during MRI scannings. It is able to estimate covariates from these recordings that can be used later in general linear model (GLM) analyses of fMRI data.
This is the python version of the original PhLEM toolbox written in Matlab (and no longer supported). The aim is to be as simple, flexible, and open as possible. Such flexibility thus assumes a very basic knowledge of Python. If you do not feel confortable or are not familiar with this programming language, we recommed that you learn at least the most basic notions. For example, a good source for this may be the scipy lecture notes.
1.2- Installing niphlem
niphlem can be easily installed through pypi as follows:
pip install -U niphlem
The dependencies, beyond those libraries that come with python distributions, are numpy, matplotlib, pandas, scipy, scikit-learn and outlier_utils. All of these are checked and installed if missing when installing niphlem.
Alternatively, if you are interested in installing the latest version under development, you may clone the github repository and install it from there directly:
git clone https://github.com/CoAxLab/niphlem.git
cd niphlem
pip install -U .
2-Physiological Signal
Niphlem is designed to exctract physiological signals (cardiac, respiration) from electrocardiogram (ECG), pneumatic belt or pulse oximeter (pulse-ox) data recordings that are collected as participants are scanned in an MRI. The toolbox was specifically written with output from the Siemens Physiological Monitoring System in mind, but is able to work with and data in BIDS compliance. In the future, more formats of input physiological data will be incorporated.
2.1- Loading physiological data from CMRR MB sequences
Under construction…
2.2- Loading physiological data in BIDS format
Under construction…
3-RETROICOR Models
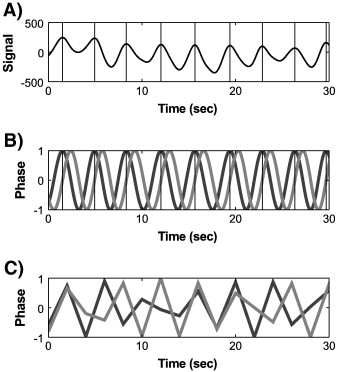
RETROICOR stands for Retrospective Image Correction and it calculates the fourier series expansion using the phases from the cardiac and respiratory cycles.
The algorithm in these models works as follows:
Extract the peaks in the physiological data. In the case of cardiac, signals these would correspond to the R components of the QRS complex. In the pneumatic belt signal, they would correspond to the peak expansion of the diaphragm. And for pulse-ox signals, the maxima in local blood oxygenation.
Estimation of a phase time to be between 0 and 2π between consecutive time peaks \(t_1\) and \(t_2\), i.e., as having full phase cycles:
Computation of sines and cosines of these phases up to a specified order, i.e. \([sin(k\cdot\phi(t)), cos(k\cdot\phi(t))]\), with \(k=1,2,\dots\)
Downsampling each of these terms to the scanner time resolution.
After these four steps, we obtain a series of phase regressors that we can use in our fMRI models to account for the physiological signal.

RETROICOR algorithm procedure (borrowed from Verstynen, 2011).
Niphlem has a class RetroicorPhysio, which preprocesses the initial data (transform and filter) and implements this algorithm to generate such regressors. For a detailed example of how to use this class, we recommend visiting the tutorial 3 and tutorial 4.
References:
Glover, G.H., Li, T.-Q. and Ress, D. (2000), Image-based method for retrospective correction of physiological motion effects in fMRI: RETROICOR. Magn. Reson. Med., 44: 162-167.
Verstynen TD, Deshpande V. Using pulse oximetry to account for high and low frequency physiological artifacts in the BOLD signal. Neuroimage. 2011 Apr 15;55(4):1633-44.
4-Variation Models
Niphlem can also generate nuisance regressors for variation in breathing rate/volume and heart rate.
4.1- Variation in breathing rate/volume regressors
The algorithm for variability artifacts from breathing rate/volume is as follows:
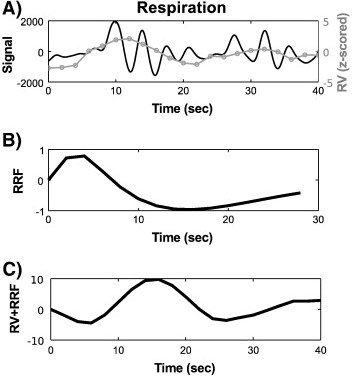
Computation of the standard deviation of the signal within a time window centered at each TR. Such a time window has been usually taken as 3*TR long (Chang, 2009). This operation thus yields a time series at the scanner acquisition time resolution.
Z-score normalization.
Convolution with the respiratory response function (RRF(t)), which reads:
Niphlem has a class RVPhysio, which preprocesses the initial data (transform and filter) and implements this algorithm to generate such regressors. For a detailed example of how to use this class, we recommend visiting the tutorial 3 and tutorial 4.

Variations in breathing rate/volume procedure (borrowed from Verstynen, 2011).
4.2- Variation in heart rate regressors
The algorithm for variability artifacts from heart rate is as follows:
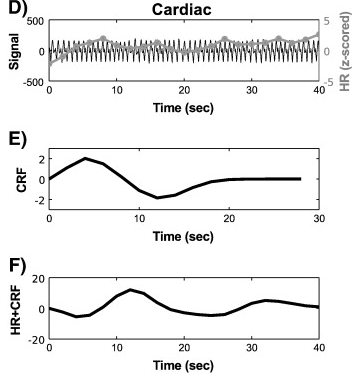
Computation of the average deviation in inter-event interval (i.e., ms between R-components of the QRS complex), per second, within a time window centered at each TR. Such a time window has been usually taken as 3*TR long (Chang, 2009). This operation thus yields a time series at the scanner acquisition time resolution.
Z-score normalization.
Convolution with the respiratory response function (CRF(t)), which reads:
Niphlem has a class HVPhysio, which preprocesses the initial data (transform and filter) and implements this algorithm to generate such regressors. For a detailed example of how to use this class, we recommend visiting the tutorial 3 and tutorial 4.

Variations in heart rate procedure (borrowed from Verstynen, 2011).
References:
Birn RM, Smith MA, Jones TB, Bandettini PA. The respiration response function: the temporal dynamics of fMRI signal fluctuations related to changes in respiration. Neuroimage. 2008;40(2):644-654.
Chang C, Cunningham JP, Glover GH. Influence of heart rate on the BOLD signal: the cardiac response function. Neuroimage. 2009 Feb 1;44(3):857-69.
Verstynen TD, Deshpande V. Using pulse oximetry to account for high and low frequency physiological artifacts in the BOLD signal. Neuroimage. 2011 Apr 15;55(4):1633-44.
5-Reports
Under construction…